Table of Contents
Until recently, the return on investment (ROI) for social marketing has been mostly a big question mark and, most probably, the lack of a tool to measure it prevented a lot of businesses to engage more heavily and purposely in social networks.
A lot of changes are happening at a fast pace with all the frequent algorithm updates on every social network, a fact that impacts the way we measure data.
I believe this is a huge step compared to the amount of data available on social marketing we had approximately a year ago. Yes, things are moving fast in the social realm and we need to keep up.
Why is it important to measure social marketing ROI?
Well, the first reason must be that of knowing that your social marketing efforts are paying off.
This is not only an online’s marketer’s characteristic, but a human being’s one.
Until some time ago, marketers have had a difficult time measuring their social marketing efforts, because they simply lacked the tools for doing that.
Measuring social marketing ROI will tell you if the time, money and creative flow you spend on your social media networks are actually worth the investment or you’re just shooting blanks.
Also, this could help you see the social impact that your campaigns are having in a specific period of time for your overall business goals.
Another reason is that discovering which networks actually work for your niche and which are a complete waste of time and learning to master those that have an impact.
What are the main objectives for measuring social marketing ROI?
As we all know, each service has to have an action plan with desired results and clear directions for a specific time frame in order for us to be able to measure it properly and make decisions.
Therefore, the objectives you set when coming up with this plan will be like the light at the end of the social media tunnel. It will guide you on optimizing and doing better, month after month.
Some of these objectives could be:
- drive website traffic
- build trust and establish brand awareness
- drive conversions (Yes, the BIG goal we all have!)
- retain more customers in a shorter period of time
What is the best social marketing metric that helps you measure ROI?
Well these three little letters that have hypnotized the marketers, that is only translated by how we can actually quantify the exact results of what we do, day by day.
The bad news is that there are innumerable ROI’s that we can measure these days and a lot of confusion in regards to which matters most.
The good news is that we have all these tools that can assist us in understanding them and deciding which matters most for us and why.
You can find the following sections related to social stats in Google Analytics under Acquisition –> All Traffic –>Channels –> Referrals–> Social.
Sources Report
The Sources report enables you to analyze which social network brings your website the most visits or page views, visitors from which channel stay longer on certain pages (average session duration) and which user visits more pages during a session (pages/session).
As a side note, I would mention that you should be careful when analyzing these metrics because they can be deceptive, especially the Average Session Duration and the Pages/Sessions metrics. Why? Because they take into consideration extreme data.
For example, if you have a non-eCommerce website, let’s say a news site, and in a given period of time 100 of your visitors visit 20 of your pages, while 1,000 visits only 1 page. This would mean that the average is 2.7 pages/session, which might be considered a good result, but in fact, 90% of your visitors view only one page, which in the case of a news site is relatively problematic.
To get the bigger picture look at the distribution table, which you can find under the Audience -> Behavior-> Engagement section. But in order for you to see the data related only to the visitors who are coming from social media networks, you will have to apply an Advanced Segment (Social Networks). I will talk about how to create such a segment in the second part of the article.
By drilling down through each channel you can analyze through which landing pages visitors from each social network came to your website, and in what time-frame.
You could discover that a piece of content from your site, which was shared by you or one of your fans/followers a week ago is still bringing a considerable amount of traffic to your site.
Site Content - All Pages
The metrics and features available are the same as in the Behavior report but from the point of view of your website’s content.
This gives you the opportunity to analyze which of your content was more “viral” and through which social channels each content was distributed.
This info will help you make decisions and structure the content you’re putting out there for each social network.
Conversions
I consider this to be the most important section and you should too because the value of the visits coming from social referrals and all the social interactions can be found in this report.
An important aspect to remember is that this section would be empty if you do not enable eCommerce tracking (if you have an eCommerce website) or set up goals, including a Goal Value (if you have a non-eCommerce website you can use the method described by Google Analytics to calculate the Goal Value.
If one of the two or both eCommerce and goals are set up, the Conversions report will be populated with the social networks you receive traffic from, together with the number of conversions and the conversion value for each social network.
In the Assisted Conversions vs. Last click or direct conversions, for each social media network you can see the number of Assisted and Last click and their value respectively, together with the ratio. But what does this all mean, you ask? Let’s see below.
- Assisted Conversions and Assisted Conversion Value shows the number and monetary value respectively, of sales and/or conversions that a particular social network assisted. An assist occurs when a visitor (coming through a social media network) leaves without converting to a goal or without buying something on your eCommerce site but returns later to convert during an ulterior visit. The higher these numbers are the more visitors came through social media channels before converting on their last visit.
- Last Click or Direct Conversions and Last Click or Direct Conversions Value shows the number and monetary value respectively, of the last click sales and/or conversions. The Last Click is considered that particular visit when a visitor converts. The higher these numbers are the more visitors converted when coming from a social media channel (in the case of that particular visit).
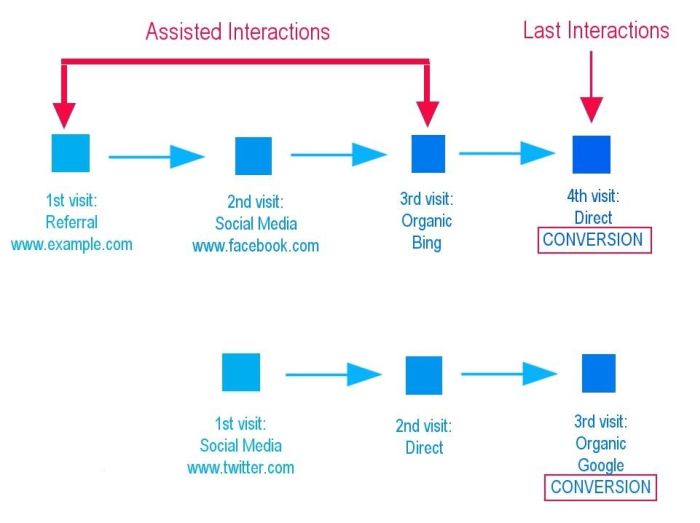
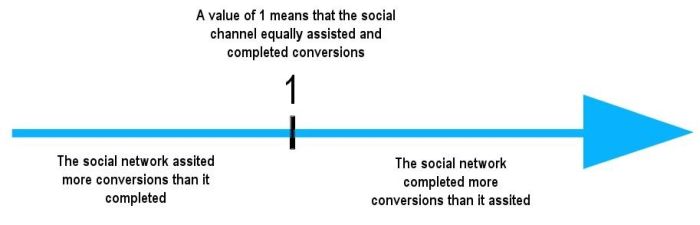
Note that if a visitor comes for the first time through a social network and converts in the same session, the Last Click Conversion is incremented, but the Assisted Conversions is not. The Assisted / Last Click Conversions ratio is interpreted in comparison to the value 1 (see chart below).
All the metrics available in this report can be viewed for all goals or just for one goal in particular (just select the goal for which you want to see the data from the drop-down list in the upper-left side).
If you are a marketer who’s lobbying for social marketing within your company, these metrics might just have the power to convince your CEO regarding the monetary value of the social networks you are active on.
Social Plugins
If you have social plugins implemented on your home page and your inner pages, with the Social Plugins (Acquisition–> Social–> Plugins) report you can see what content is liked and tweeted directly from your website.
This could be another metric that shows you which of your content and what kind of content is more appealing to your visitors to share and on which channels. If you have the plugin implemented only on your home page, then the report will show you data only for this page.
Take note that by default Google Analytics only included in the Social Plugin reports from Google Plus. Now that Google Plus is gone, you will have to manually include Facebook and Twitter, for example, so changes to the tracking code have to be made
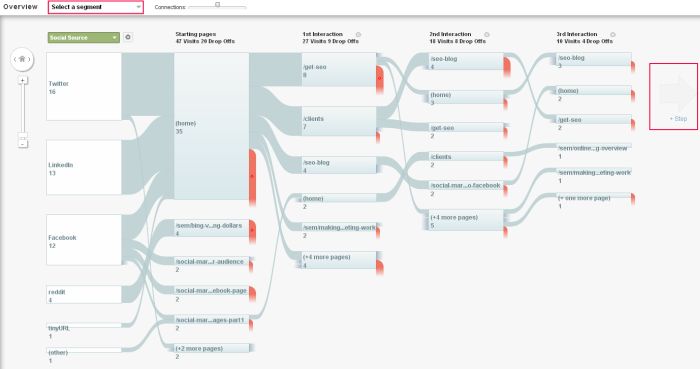
Users Flow
This visually represents what pages did the visitors, coming from social networks, viewed during a session on your website, where they left your website and so on.
Thus, you can observe which pages are considered important by visitors coming from social networks and which pages need improvement (looking at the number of visitors who left after viewing a particular page).
If you want to see more levels just click the arrow in the right. If you want a more thorough analysis, for example for new visitors or visits with conversions, select an advanced segment from the drop-down list in the upper-left corner.
You also have the option to see the flow for visitors coming from a particular social network, just left-click on the particular channel you would like to analyze and select “highlight traffic through here” or “view only this segment”.
You can do the same with a particular page as well.
Advanced Segments
If you want additional data on your visitors than what Social Reports, the location they come from, the operating system/browser they use, how much of your social traffic is returning visitors and so on you could create an Advanced Segment that includes only social traffic.
You can use this method to see the distribution table for social traffic when it comes to average pages/visit and visit duration (in the Audience section under Behavior).
For example, we created our “Social Networks” advanced segment using the following Regular Expression:
facebook\.com|m\.facebook\.com|twitter\.com|digg\.com|stumbleupon\.com
|linkedin\.com|technorati\.com|myspace\.com|bit\.ly|delicious\.com|reddit\.com
|t\.co|goo\.gl
After you save it, you can edit it to better fit your analysis needs, or you can add other social networks we did not include.
If you observe that you are using Advanced Segments quite often you might want to consider creating an additional profile, in which you include only social traffic.
If you add the data available from Google Analytics to the number of followers, likes or the Number of Interactions, Total Reach, check-ins and so on, you are able to draw a comprehensive picture about the results your social media activity has and take informed decisions regarding steps to be taken.
Google Data Studio
Apart from the valuable information that you are obtaining from Google Analytics, there’s another tool created by Google that will help you quantify the results from the social media channels you use to promote your business.
This one tool will help you with the reporting segment of your activity, that of course, will involve data from social networks.
But, before you can access this data for the sole purpose of analyzing it and presenting it to your client, you’ll have to create a Google Sheet in which you’ll have to introduce the main metrics that interest you.
Then, month after month, with the help of social reports that you’ll have to download from your desired social networks, you’ll get to analyze and compare data with that offered by Google Analytics in order to have a clear, encompassing picture of all your social marketing efforts.
Of course, befriending Google Data Studio is not an easy task, but, in the end, it will pay off. Give it try!
Are your social marketing campaigns paying off?
Is your strategy working as you planned?
What are some creative and unique ways that you measure the results of your social marketing activities?
Get in touch with us and tell us more!